

You’re not going to be able to gauge the financial health of your business without all the facts.
The problem is that there’s a whole lot of data out there, and it can be quite difficult to get everything in one place to perform some much-needed analysis.
That’s where financial statements come in.
Financial statements offer an insightful window into your company’s performance. But there are several different types of financial statements, and they’re each designed to tell you something different about your company’s financials.
This guide will explain the three basic types of financial statements, what to look for, and the three main ways to analyze financial statements.
What are the three basic financial statements?
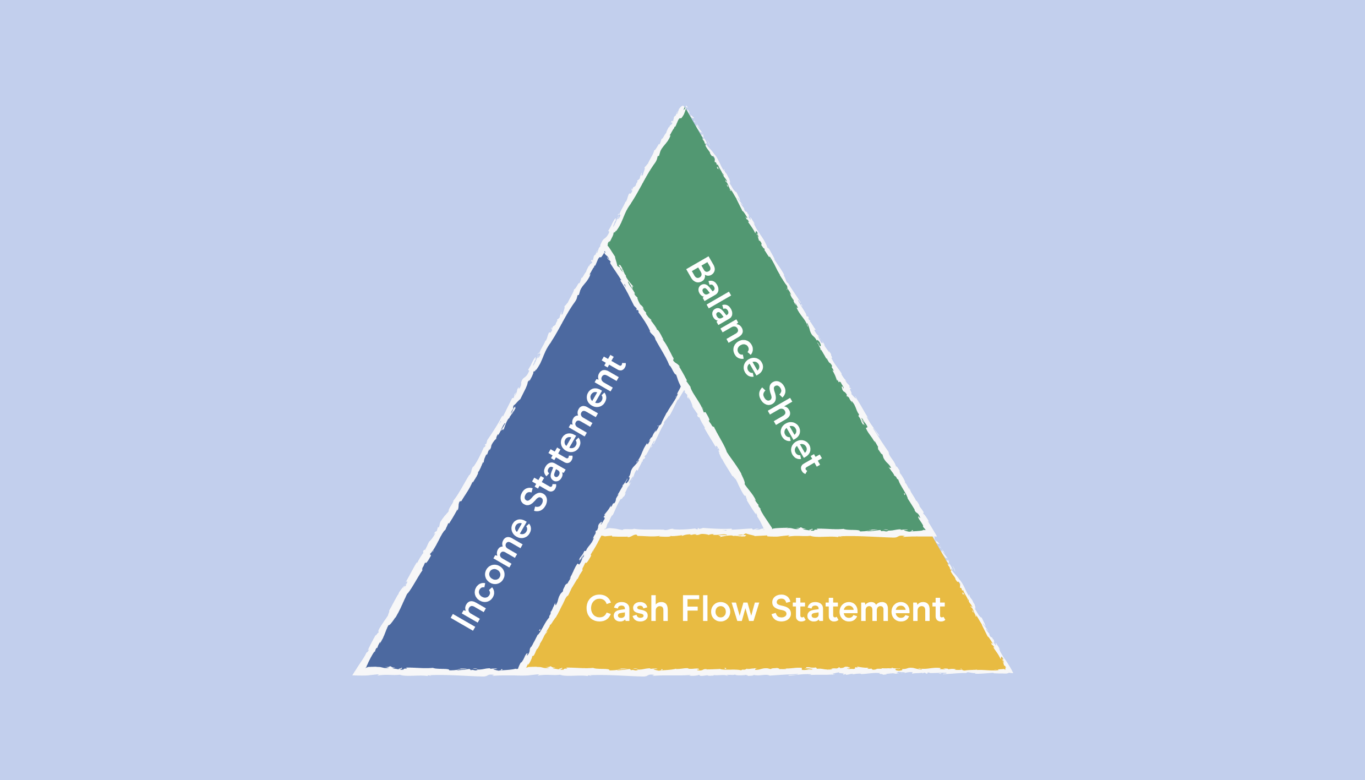
If a C-level executive starts trying to talk to you about your company’s financial statements, don’t stress. Chances are, they’ll be referencing one of three main types of financial statements. Those three are your balance sheet, income statement, and cash flow statement.
They’re all relatively straightforward, and each one serves its own purpose. To help you wrap your head around each financial statement type, we’ll quickly walk you through how each works.
Balance sheet
The first type of financial statement you’ll run into is called a “balance sheet.”
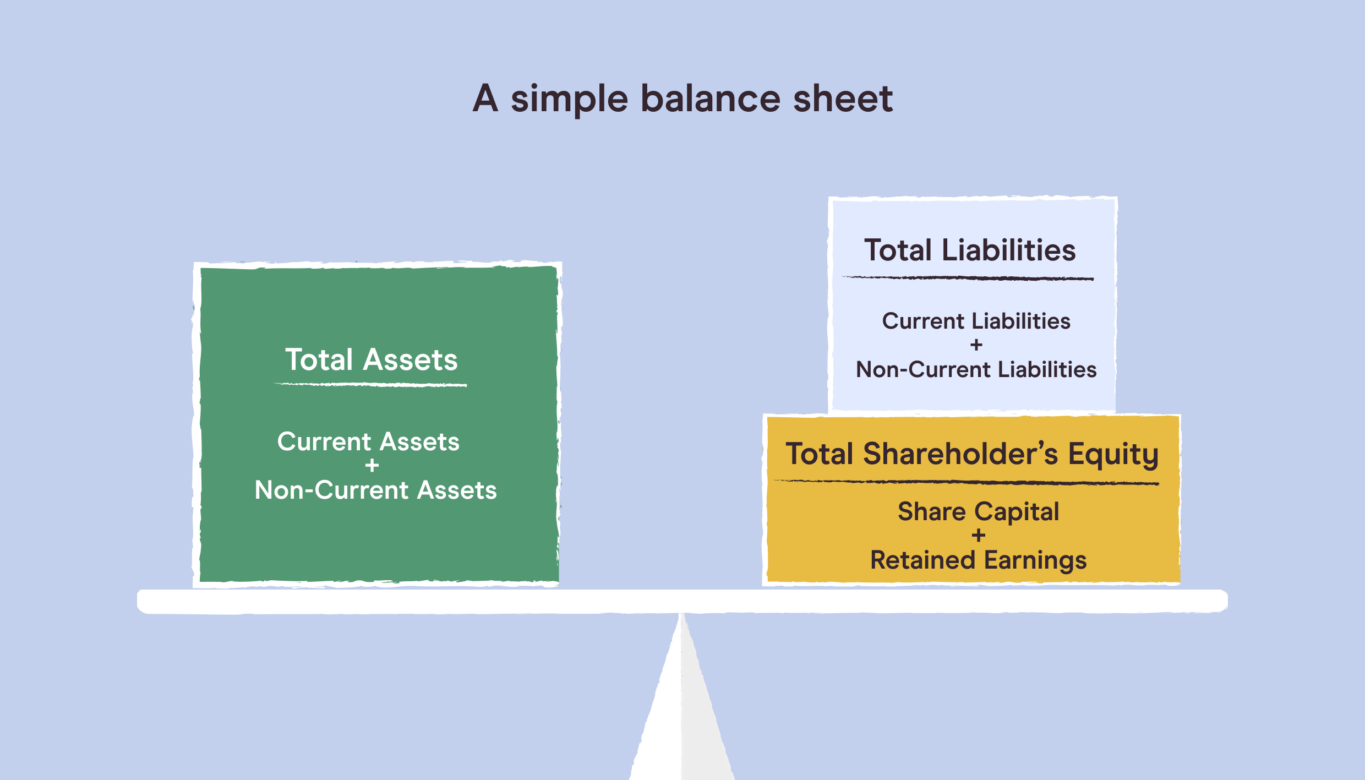
A balance sheet is a table that should show you all of the resources your organization has available and how they’ve been financed up to a certain date. In addition, it should spell out all of your company’s assets, owners’ equity (or “shareholder equity“), and liabilities.
Translation: your balance sheet should tell you the book value of your business. It spells out what your company owns, what it owes, and what’s been invested by shareholders.
Balance sheets are also helpful if you want to figure out your organization’s rate of return or evaluate your capital structure. All the data you need for this type of financial analysis is always sitting right there in your balance sheet.
Income statement
A company’s income statement is essentially a summary of all its revenue, expenses, losses, and gains over a specific period. You may also sometimes hear people refer to an income statement as a profit-and-loss (P&L) statement.
Income statements are critical for accountants and investors so they can analyze and report on how the company is doing in terms of its incomings and outgoings. They’ll often be included in quarterly reports or annual reports because income statements paint a pretty basic picture of how a company’s business activities are performing during a set period,
Income statements also enable organizations to spot any emerging financial trends that it needs to react to.
Cash flow statement
A cash flow statement is useful if you want a more detailed picture of how your company’s cash positions have changed during an accounting period. If this term is new to you, “cash flow” is just a fancy way to describe the net amount of cash inflow and cash-equivalents being transferred to and from your company during a given period.
Cash flow statements can be split into three different parts. Those parts are your:
- Cash flow from operating activities
- Cash flow from investment activities
- Cash flow from financing activities
Companies like to watch their cash flow because it paints a pretty good picture of whether the business has enough money to operate in the short-term and long term. But, of course, this is all based on how much cash moves in and out.
What do you look at in financial statements?
Balance sheets, income statements, and cash flow statements all have unique data sets and important information that you’ve got to consider when reading them.
To make things as simple as possible, we’ll split the information you’re looking for by financial statement type.
What to look for in a balance sheet
Balance sheets primarily focus on showing what your company has and what it owes.
Bearing that in mind, this is what you should be looking for in your balance sheet:
- The current assets your company owns or expects to liquidate (or sell) within the next 12 months.
- The noncurrent assets that your company considers a long-term investment. These are the assets that won’t be sold and turned into cash any time soon.
- The current liabilities you expect to repay to lenders within the next year.
- The noncurrent liabilities and financial obligations that your business owes but won’t need to be repaid within 12 months.
- Your shareholders’ equity is all the equity that belongs to business owners after paying off liabilities. In other words, if you sold everything your company owned (assets) and paid off all your debts (liabilities), any money you had left would be your shareholders’ equity.
What to look for in an income statement
Income statements show you all of your company’s revenue, expenses, and costs.
When you look at a balance sheet, you should see:
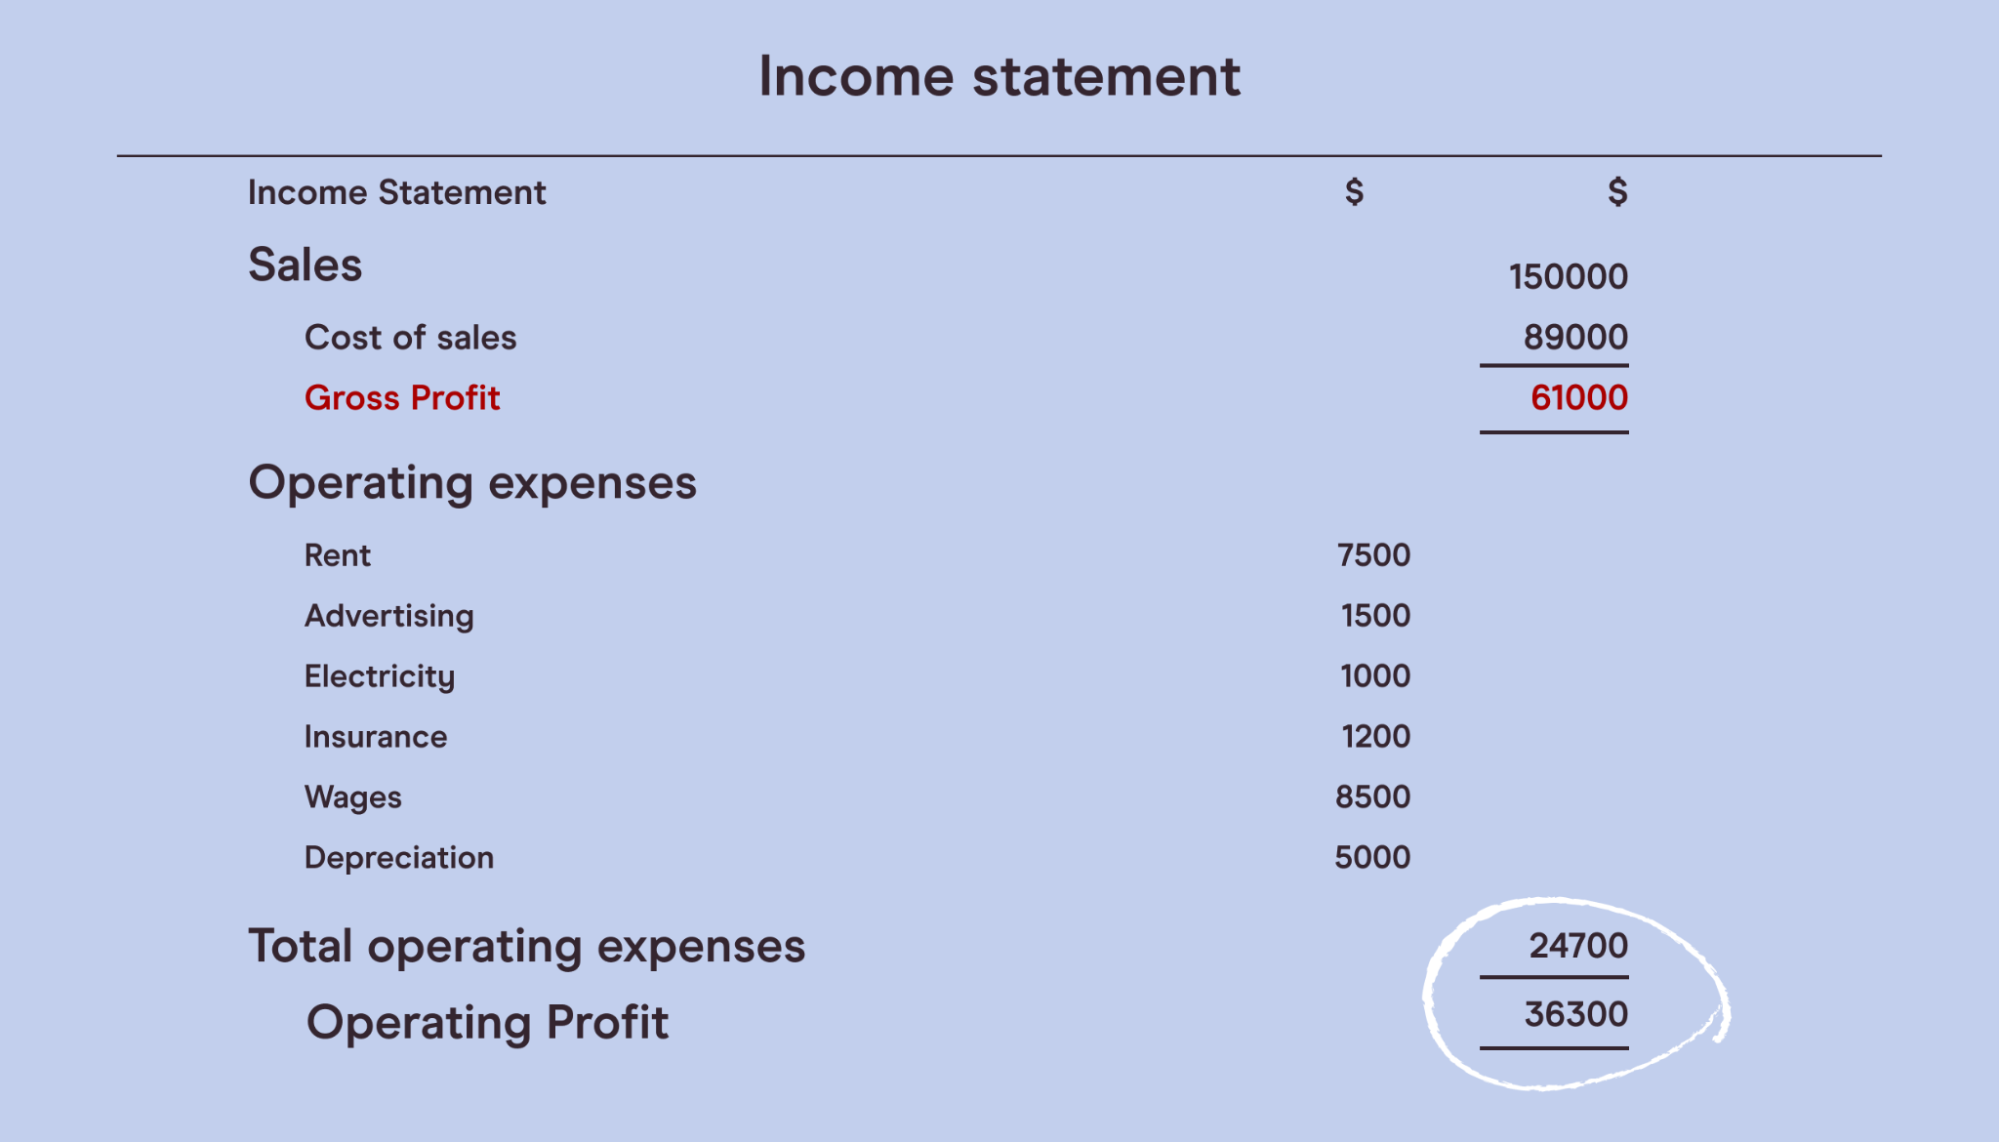
- Your revenue, which is the amount of money you’re taking in.
- Your expenses, which includes everything your business spends. This also includes your cost of goods sold (COGS), which specifically refers to how much it costs to make each part of what your business sells.
- Your gross profit, which is your revenue minus your COGS.
- Your operating income, which is your gross profit after operating expenses.
- Your net income, which is your bottom line after all your expenses are taken out. Your net income may be shown on an income statement in several different ways. Those include:
- Earnings before taxes (EBT), which is your company’s income before you’ve paid your taxes
- Earnings before interest and taxes (EBIT), which is your company’s income before you’ve paid your taxes and interest expense linked to debts like loans
- Earnings before interest, taxes, depreciation, and amortization* (EBITDA), which is how much money your company’s made before you take out taxes, interest, depreciation, and amortization.
- Your earnings per share (EPS), which is your company’s net income divided by the total number of outstanding shares in your company.
*Note: Amortization and depreciation expenses are used to show how much value your assets have lost over a given time period. The only difference is that amortization is used for intangible assets (like patents), and depreciation is used for tangible ones (like buildings).
What to look for in a cash flow statement
A cash flow statement measures how healthy your company’s cash position is looking.
It’s split into three different segments:
- The first segment is operating activities. This part looks at the cash flow your company generates when it delivers on goods and services. Operating activities include revenue and expenses.
- Next, you’ve got investment activities. This section looks at how much you’ve generated buying or selling assets using real cash rather than debt.
- Finally, there are financing activities. This includes your cash flow from debt and equity financing. For reference, “debt” is generally any money that you’ve borrowed and have to pay back. Equity financing is when you sell shares in your company to get cash.
It’s also important to note two ways you can calculate your cash flow: the direct method and the indirect method.
If you want to use the direct method, you’d calculate all your operating cash collections, then subtract all the cash you paid to fund operating activities.
To use the indirect method, you’d calculate your net income, then adjust it to mitigate the impact of debts and expenses you might have racked up during a given time but have not actually paid out cash for.
What are the three main ways to analyze financial statements?
There are three ways that most organizations will analyze financial statements. They’ll either choose horizontal analysis, vertical analysis, ratio analysis, or a combination of the three.
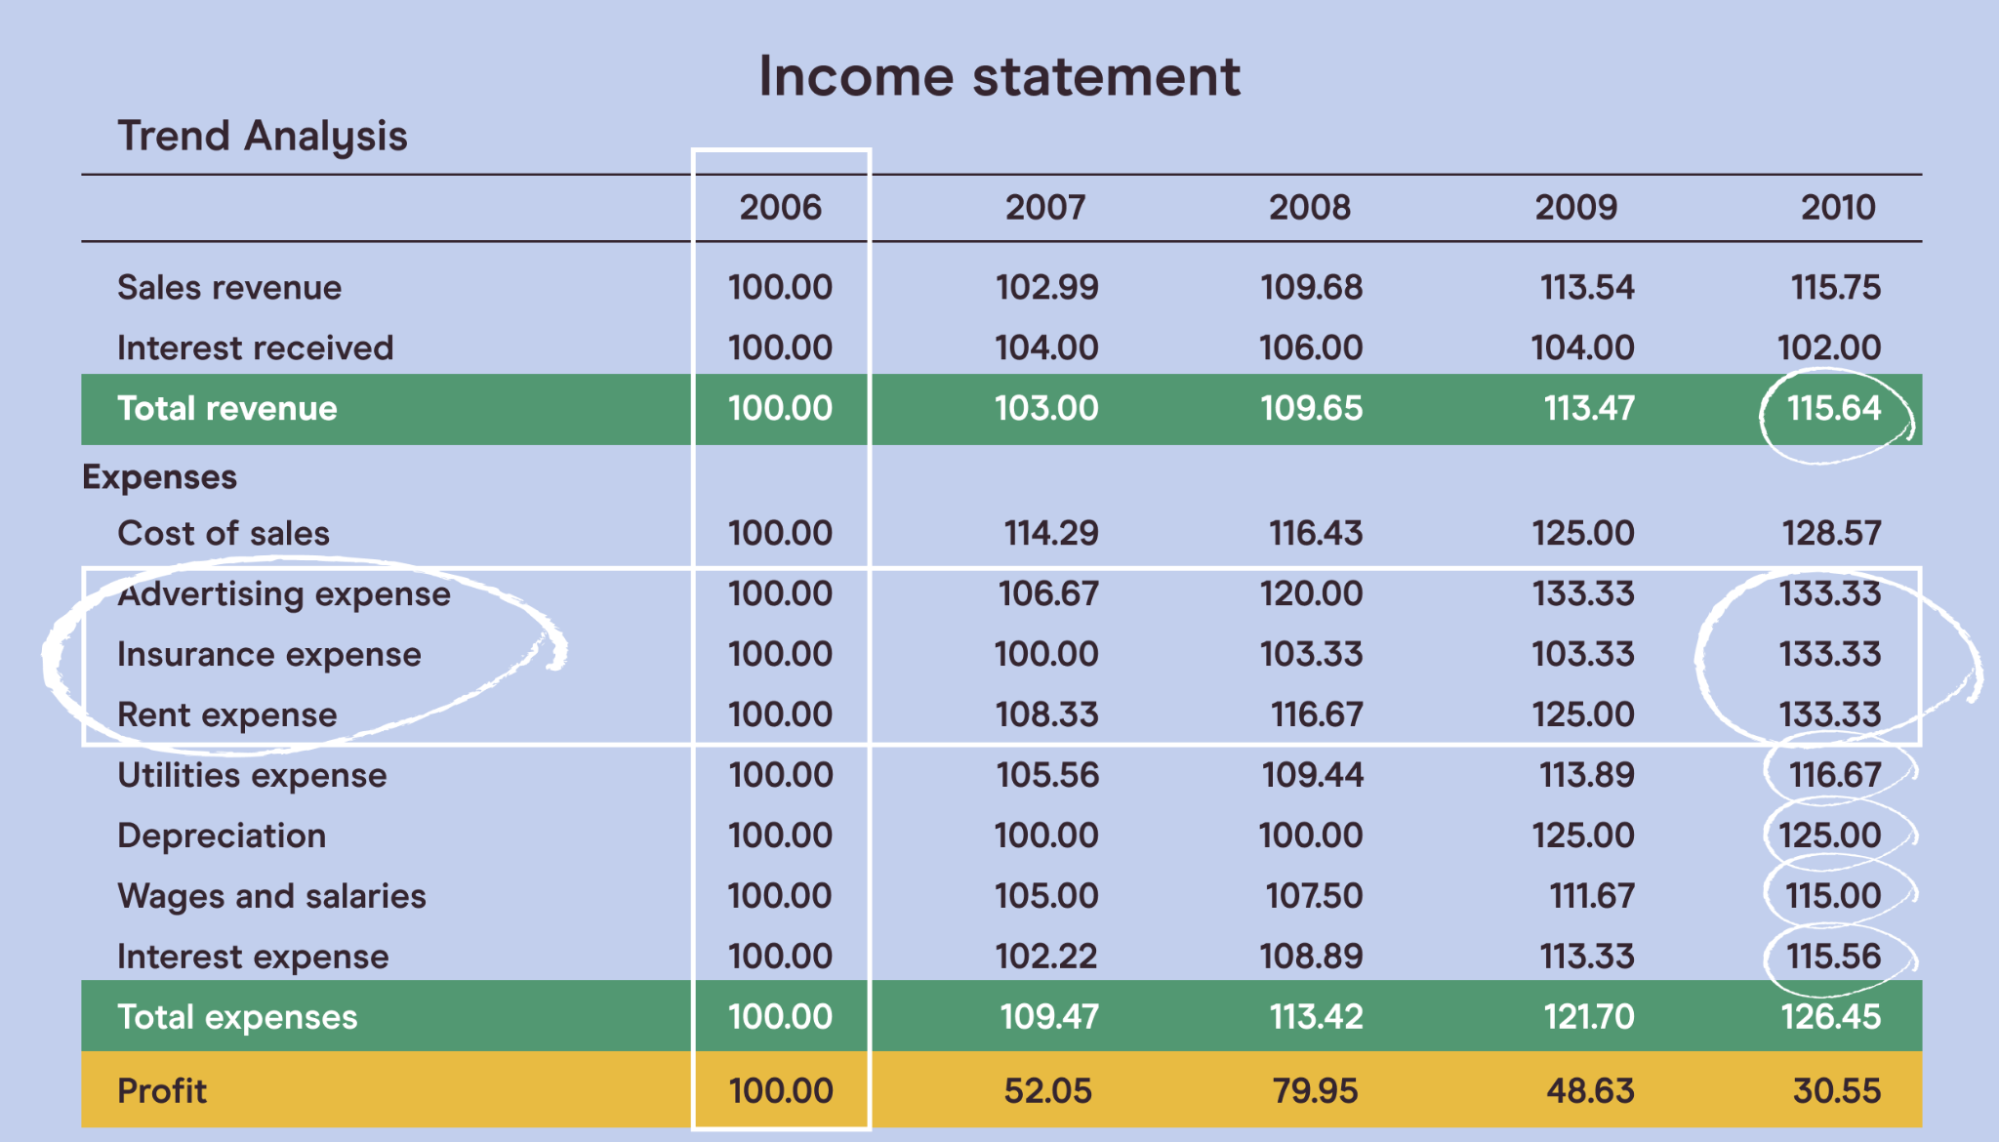
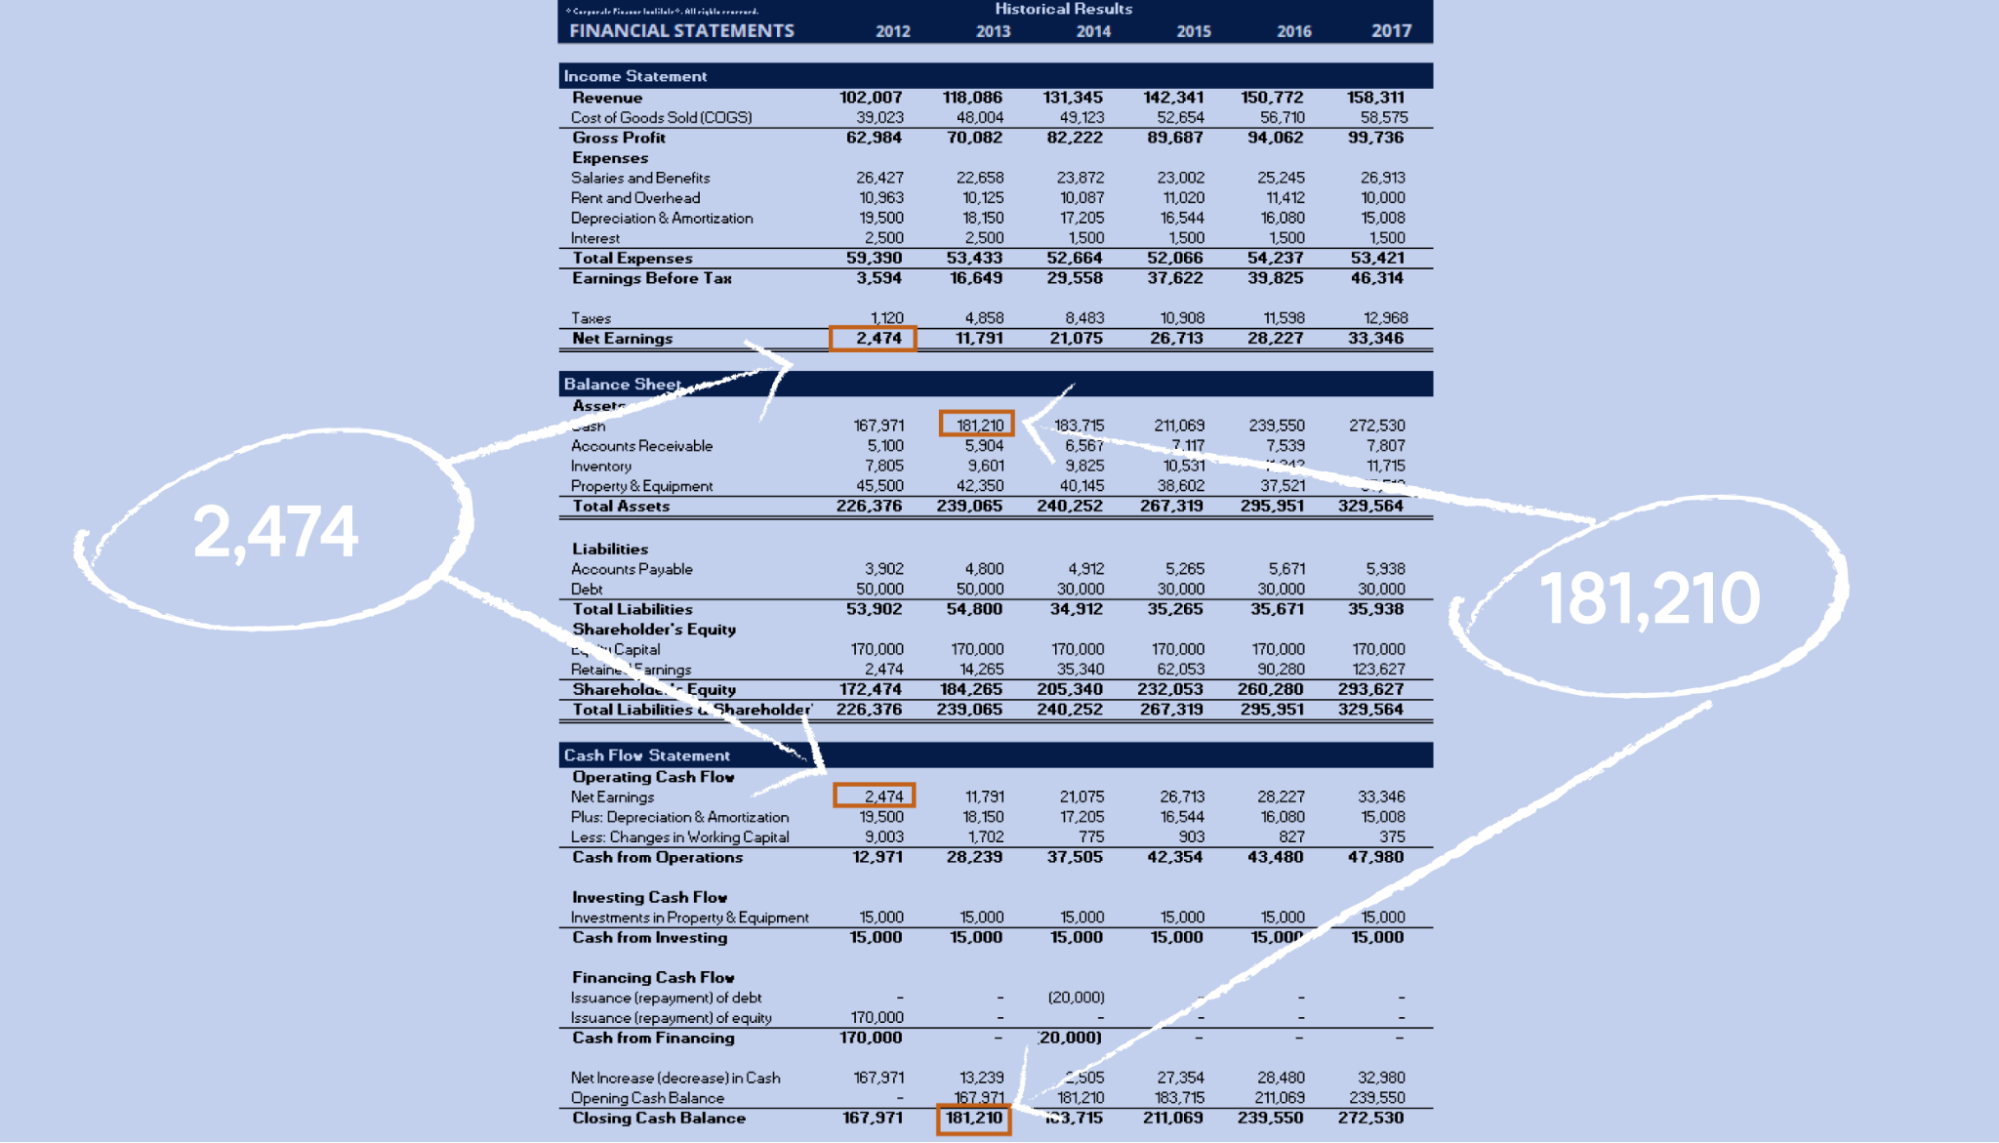
Horizontal financial statement analysis is when you analyze the value of line items horizontally across several years. Horizontal analysis is designed to help you identify which factors have been driving your financial performance and spot any trends of growth patterns.
Vertical financial statement analysis shows the vertical effect a line item has on other parts of your business by assigning each line item a percentage of a base figure in your statement. This enables you to get a quick snapshot of how each area of your business has performed, and it’s easy to compare to other periods, companies, or industries.
Ratio financial statement analysis helps accountants figure out the statistical relationships between line items. By using ratio metrics, you can see how your company is performing over time. It’s then pretty easy to compare your financials to competitors using the same equations.
For example, you might want to compare a metric like the gross profitability of your company versus your nearest competitor. Your gross profitability is all of your profits divided by your net sales. So if you know your annual gross profitability was $100,000 and the gross profitability of your nearest competitor was $75,000, you’d be able to better gauge your market success.
Conclusion
No matter how you look at your financial statements, it’s important to consider different angles that will help you develop a holistic picture of your company’s financial statements.
After all, without knowing what the full picture looks like, it’s incredibly difficult to make well-informed decisions about your company’s future.
That means you’ve got to understand what to look for in an income statement, balance sheet, and cash flow statement. But, more importantly, you need to be able to analyze that data to identify patterns, figure out what you’re doing well and what you could be doing better.
Are you ready to learn more about how to read financial statements? Take our course on this topic and many more to develop the tools you need to make more strategic decisions at work, understand a CEO’s decisions, invest wisely for the future, and manage employees with confidence.
Pareto Labs offers engaging on demand courses in business fundamentals. Built to help you elevate your game at work, our courses distill complex business topics — like how to read financial statements, how to manage people, or even how to value a business — into digestible lessons. No business background required. Our library of 200+ lessons will teach you exactly what you need to know to use it at work tomorrow. Sign up for a free trial today to start watching.