

The raw numbers reported on a company’s financial statements are informative, but to unlock insights, spot trends, and compare against competitors, you have to look at the relationship between those numbers. That’s where financial ratios come in. There are four types of financial ratios, each of which tells a different part of a company’s financial story.
The Basics
- Ratios tell a more complete story about a company’s financial health than numbers alone.
- Financial ratios are a comparison between two numbers that can reveal how a company operates, aspects of its financial health, and how it stacks up against competitors.
- There are four types of financial ratios: profitability, leverage, liquidity, and efficiency ratios.
What are financial ratios?
A financial ratio is simply the relationship between two numbers taken from a company’s financial statements. You generate a ratio by dividing one number by the other. Ratios will sometimes use numbers from the same statement—the income statement, for example—or from different statements.
There are four types of financial ratios:
- Profitability ratios tell you how well a company is producing profits
- Leverage ratios tell you how extensively the company uses debt
- Liquidity ratios tell you if the company has enough cash to cover its bills
- Efficiency ratios tell you how efficiently the company uses its assets and capital.
Different ratios tell you different things, which means that a high ratio isn’t necessarily good or bad. For some measures, a high ratio is desirable; for others, a low ratio is desirable.
Profitability ratios
These ratios use numbers on the income statement to give you a picture of how well a company is doing at taking things like revenue, assets, operating costs, and equity and turning them into profit.
Gross profit margin ratio
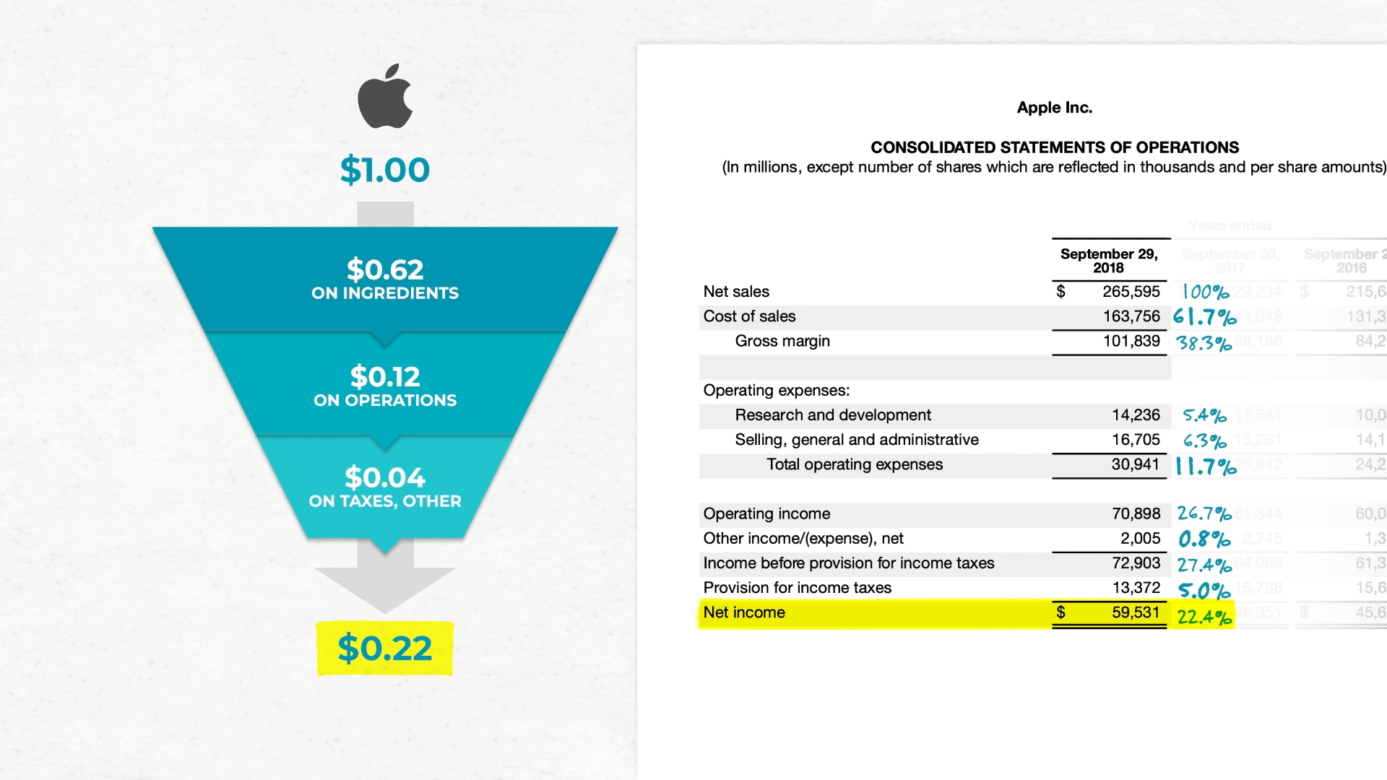
Gross profit margin is the ratio of gross margin to net sales, expressed as a percentage. This ratio answers the question: For every dollar of sales, how much do we make after paying for the ingredients and costs directly associated with making the product?
Gross profit margin percentage = (Gross margin / Net sales) x 100%
In this equation:
- Gross profit is the difference between net sales and the cost of net sales.
- Net sales is the company’s total revenue from sales minus returns and discounts.
The gross profit margin ratio is a key indicator for how much profit a company makes from what it sells, given the cost of making their product. Generally, the higher the gross profit margin percentage, the better a company is at turning sales into profits.
Operating profit margin ratio
Operating profit margin is the ratio of operating income to revenue, expressed as a percentage. This ratio answers the question: For every dollar of sales, how much money do we have left over after paying for materials and overhead?
Operating profit margin percentage = (Operating income / Net sales) x 100%
In this equation:
- Operating income is a company’s total revenue minus COGS (cost of goods sold) and operating expenses.
- Net sales is the company’s total revenue from sales minus returns and discounts.
The operating margin ratio is a key indicator for how well a company can earn profits from its core product or service offering. Generally, the higher the ratio, the better a company is at turning sales into profits.
While this ratio is similar to the gross profit margin ratio in that both measure how profitable a company is, gross profit margin subtracts costs associated with production and distribution, whereas operating profit margin subtracts additional costs: COGS and operating expenses. Non-operating expenses like taxes and interest are still not accounted for—but they will be in the next ratio.
Net profit margin ratio
Net profit margin is the ratio of net income to net sales, expressed as a percentage. This percentage answers the question: For every dollar of sales, how much money do we have left over after paying for everything, including interest and taxes?
Net profit margin percentage = (Net income / Net sales) x 100%
In this equation:
- Net income is a company’s total profits after subtracting the cost of all of its expenses from revenue generated over a reported period of time.
- Net sales is the company’s total revenue from sales minus returns and discounts.
The net profit margin percentage is a key indicator of how much money the company is making when all is said and done. A higher percentage means a healthier business and happier shareholders, since this is the money that can be reinvested in the business or paid to shareholders in the form of dividends.
Return on assets percentage
Return on assets is the ratio of net income to assets, expressed as a percentage. This ratio answers the question: For every dollar tied up in your business, how much comes back as profit?
Return on assets percentage = (Net income / Assets) x 100%
In this equation:
- Net income is a company’s total profits after subtracting the cost of all of its expenses from revenue generated over a reported period of time.
- Assets are everything you’ve got invested in your business, including cash, equipment, factories, offices, or other real estate.
The return on assets ratio is a key indicator of whether a company is using its assets well; in other words, how profitable a company is, according to its assets. A good return – assets percentage is considered to be anything over 5%; a percentage below that could mean the company isn’t profitable enough. Anything over 20% is considered outstanding. But keep in mind that an extremely high percentage may indicate another kind of issue—for example, perhaps the business isn’t investing enough in new equipment.
What’s considered a good or great percentage can also vary across industries, which makes sense if you think about it: A financial services company will have very different assets from a car maker.
Return on equity percentage
Return on equity is the ratio of net income to shareholder’s equity, expressed as a percentage. This percentage answers the question: For every dollar that shareholders invest in the company, how much is coming back as profit?
Return on equity percentage = (Net income / Shareholders’ equity) x 100%
In this equation:
- Net income is a company’s total profits after subtracting the cost of all of its expenses from revenue generated over a reported period of time.
- Shareholders’ equity is total assets minus total liabilities.
While a high return on equity will make shareholders happy, it can also indicate that the company is taking out loans to finance their business, and thus may have an unreasonable amount of debt.
Leverage ratios
Leverage ratios indicate how companies use debt. While debt can help a company get a higher return on its cash investment, too much debt increases the probability of bankruptcy.
Debt to equity ratio
Often referred to as” D/E ratio,” the debt to equity ratio measures a company’s liabilities against its shareholder equity. This ratio answers the question: For every dollar of equity, how much debt is there?”
D/E ratio = Total liabilities / Shareholders’ equity
In this equation:
- Total liabilities are all of the debts or obligations that detract from a company’s value.
- Shareholders’ equity is total assets minus total liabilities.
The D/E ratio is used to analyze a company’s financial leverage, or how a company is using its debt to finance its operations and assets. Put another way, it compares a company’s liabilities (all the debts it still owes) to its equity (assets minus liabilities), producing a number that tells you whether the company’s debt is helping it grow.
Using debt can be a good thing, as it can increase the return shareholders get on the money they invested in the business. For this reason, you wouldn’t expect the D/E ratio to be 0, or even less than 1. But a number that is high can indicate increased risk of bankruptcy, if the company is taking on more debt than it could ever pay back.
Interest coverage ratio
Interest coverage is the ratio of operating profit to annual interest charges. Operating profit is used in this ratio instead of net income because operating profit is calculated excluding interest payments.
Interest coverage ratio = Operating profit / Annual interest charges
This ratio should tell you how much money a company has left over to pay interest. It’s often used by banks to determine whether a loan should be approved, because it indicates if a company likely has enough money to pay back its debt, plus interest.
Liquidity ratios
Liquidity is all about cold, hard cash—though it also extends to the liquid assets a company can convert to cash quickly. Cash is life in business, so these ratios tell you if a company will have enough cash in the near term to meet its obligations.
Current ratio
The current ratio is a ratio of the company’s current assets to current liabilities. This ratio measures a company’s ability to produce cash to pay for its short-term financial obligations, also known as liquidity.
Current ratio = Current assets / Current liabilities
A ratio above 1 means the value of a company’s current assets is more than its current liabilities. A number less than 1, on the other hand, means that liabilities outweigh assets. For the company, this could point towards financial issues with creditors, growth, or production, and could ultimately lead to bankruptcy.
Quick ratio
A quick ratio differs from a current ratio in one aspect: it subtracts inventory from current assets. Inventory is your actual product, and therefore the only aspect of your current assets that can’t be converted into cash quickly (you’d need to sell all of it off to turn into cash).
Current ratio = Current assets – Inventory / Current liabilities
Efficiency ratios
Efficiency ratios measure how efficiently assets and liabilities are being managed.
Asset turnover ratio
Asset turnover is a ratio of net sales to average total assets. It answers the question: how well assets are being used to create sales?
Assets turnover ratio = Net sales / Average total assets
This is a key indicator of how well a company’s investment in assets (a new factory for example) is helping it generate sales.
Inventory turnover ratio
The inventory turnover ratio illustrates how many times a company has sold out inventory over a given time period. It’s calculated using financial information found on both a company’s income statement and balance sheet. Cost of Goods Sold is found on the income statement, while the inventory values at the beginning and ending of the month (or whatever time period you wish to calculate) is indicated on the balance sheet.
Inventory turnover ratio = COGS / Average inventory
In this equation:
- COGS or the cost of goods sold is the direct cost of making and distributing a product.
- Average inventory is the value of inventory at the beginning and end of the given time period, added together and divided by 2.
A high inventory turnover ratio is typically better than a low one, though there are deviations from this rule. A high ratio could indicate stellar sales, but it could also mean that demand for a company’s product or service exceeds the supply.
Days in inventory ratio
Days in inventory is a ratio of average inventory over a period of time divided by cost of sales per day. This ratio answers the question: How long does inventory stay in the system?
Days in inventory ratio = Average inventory over time period / cost of sales per day
This ratio is a key indicator of how you are managing your inventory. Industry norms vary, but generally you should want this ratio to be low. That means your inventory is generating cash quickly. But if it’s too low, it could mean that you’re not producing enough inventory, or you’re experiencing delays that could make for a bad customer experience.
Days sales outstanding ratio
Days sales outstanding is a ratio of average accounts receivable to net sales per day, divided by days in a year. This ratio answers the question: How many days does it take, on average, for customers to pay their bills.
Days sales outstanding ratio = (Average accounts receivable / Net sales) / 365
While getting customers to pay outstanding bills may seem like it’s outside of the business’s control, this ratio can still tell you something about how the business operates. If the number is too high, it means that the company needs to improve its ability to collect on invoices.
Pareto Labs offers engaging on demand courses in business fundamentals. Built to help you elevate your game at work, our courses distill complex business topics — like how to read financial statements, how to manage people, or even how to value a business — into digestible lessons. No business background required. Our library of 200+ lessons will teach you exactly what you need to know to use it at work tomorrow. Sign up for a free trial today to start watching.
