

Whether you’re a new business owner, looking to invest in securities, or just trying to hone your skills, financial statements are a solid starting point. Understanding financial statements is also important if you’d like to keep your finger on the pulse of companies’ financial health—or even make big-picture business decisions at your own job.
The Basics
- Financial statements are detailed records of a company’s assets, liabilities, equity, revenue, expenses, and cash flows that help various parties analyze the financial performance and stability of a company at any given time.
- A balance sheet provides an overview of a company’s assets, liabilities, and shareholder equity, showing how much money a company would lose or retain after selling all assets and paying off all debts.
- An income statement shows the amount of sales, expenses, and profit flowing through a business over a period of time. This statement is sometimes called the Profit and Loss Statement, or “P&L” for short. It culminates in the “bottom line,” which shows a company’s profitability, or net income, after all costs are accounted for.
- A cash flow statement is a detailed measurement of cash inflows and outflows to determine if a company is generating enough revenue to cover its debts, expenses, and investments.
What are financial statements?
Financial statements are written or digital records that disclose a company’s business activities and performance at a certain point in time. These records are essential, generally prepared annually or quarterly, and used by a number of stakeholders and parties to examine the company’s financial health and earning potential.
Under the Generally Accepted Accounting Principles (GAAP), the Financial Accounting Standards Board requires regular and consistent financial reporting for public companies. There are three key components in a basic financial statement:
- A balance sheet
- An income statement
- A cash flow statement.
Balance sheet
A balance sheet shows the company’s total assets, and how they’re financed—through debt or equity. Balance sheets are based on a fundamental formula:
Assets = Liabilities + Equity
In this equation:
- Assets: Include any current or fixed assets, including cash or cash equivalents, such as certificates of deposit, Treasury bills, or short-term government bonds; accounts receivable for the sale or delivery of the company’s product or service; inventory; or any other sources of income.
- Liabilities: Could include accounts payable and wages (both short term obligations), or long term liabilities like bank loans and other debt.
- Shareholder equity: Indicates how much money a company’s owners have invested into the business. Shareholder equity can include common shares, preferred shares, or retained earnings.
- Common shares: Shares of a company that allow the holder voting rights
- Preferred shares: Shares of a company with dividends that get paid out before common share stockholders
- Retained earnings: Net income not paid out to shareholders at the end of each period
Balance sheet example
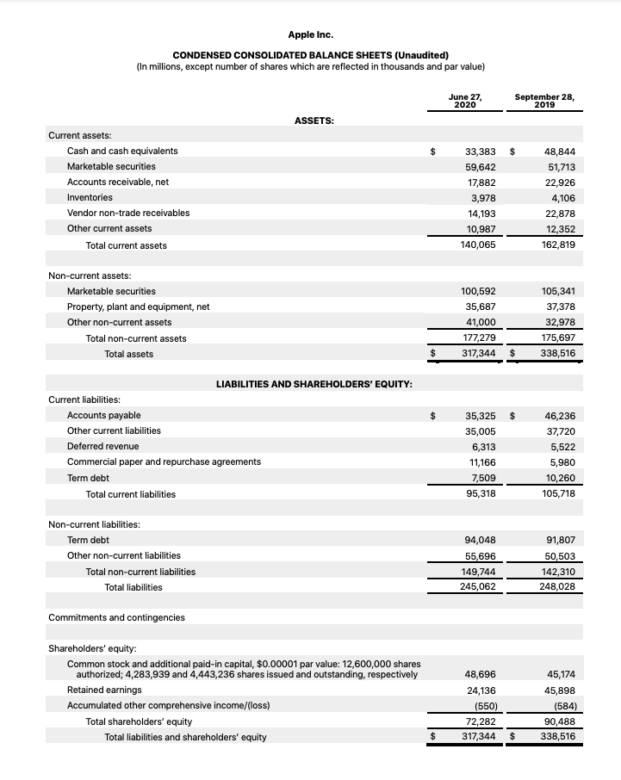
Consider Apple’s balance sheet for the third quarter of 2020. As is specified on the sheet, the numbers presented are in millions, except for the number of shares, which are reflected in thousands and par value.
- Total assets: $317,344
- Total liabilities: $245,062
- Total equity: $72,282
- Total liabilities and equity: $317,344
Income statement
An income statement reports revenues and expenses, and net income of a company for a certain period of time. Accounting periods can vary. For annual reports, that period of time would cover a year; for quarterly statements, it would cover a three-month quarter.
The income statement culminates in the “bottom line”—physically, the bottom line—of the report, which shows you a company’s profitability after all costs are accounted for. Income statements are based on another fundamental equation:
Net income = Revenue – Expenses
In this equation:
- Net income: A company’s total profits after subtracting the cost of all of its expenses from how much revenue the company generated for a certain period
- Revenue: Includes operating and non-operating revenue. Operating revenue is cash generated by the sale of a company’s core product or service offering. Non-operating revenue represents cash generated from services or activities outside of the company’s core business plan, such as interest earned on cash in the bank or income from partnerships like affiliate programming or royalty payments.
- Expenses: Includes primary and secondary expenses. A company’s primary expenses are referred to on the income statement as cost of sales, or cost of goods sold (COGS), and involve costs absorbed due to the creation or delivery of a product or service. These could include materials and production costs. Secondary expenses are known as operating expenses and are the costs associated with helping the business run; these could include rent, utilities, or research and development.
Income statement example
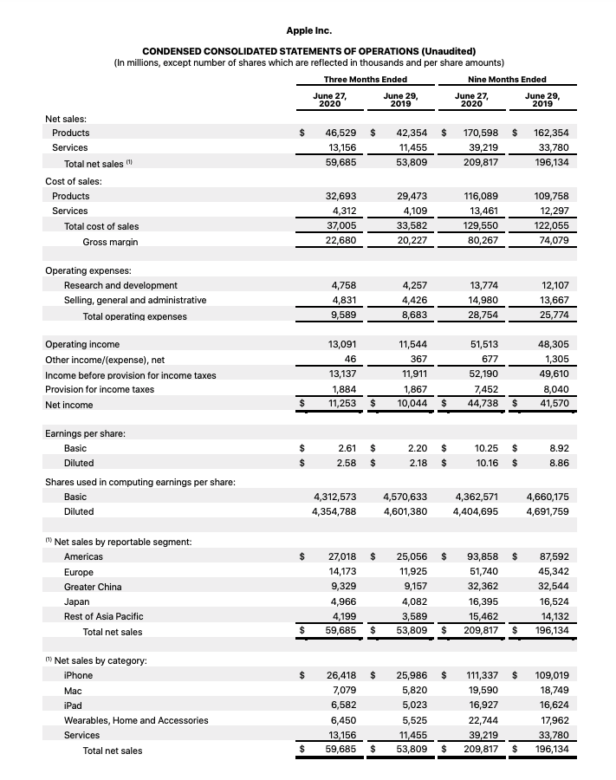
Find Apple’s income statement for the third quarter of 2020 below. As is specified on the sheet, the numbers presented are in millions, except for the number of shares, which are reflected in thousands and par value.
- Total revenue (for quarter ending June 27, 2020): $59,685
- Total cost: $9,589
- Net income or profit: $11,253
Cash flow statement
A cash flow statement—or statement of cash flows—is a measure of how much cash is entering and exiting the business over a period of time.
Unlike the balance sheet, a cash flow statement is not centered on a formula. However, there are three sections on the statement that show cash flows for different parts of the business.
- Operating activities: Cash flow associated with the core functioning of the business. Operating activities could include the sale of its product or service, accounts payable or receivable, inventory, or rent.
- Investing activities: Expenses associated with a company’s investments or revenue generated by investments made in the company. Investing activities could include the purchase or sale of assets, equipment, or loans made to vendors or customers.
- Financing activities: Funds sent to or received from investors or banks. Financing activities could include debt repayment, equity issuance, bank loans, or stock repurchases.
Cash flow statement example
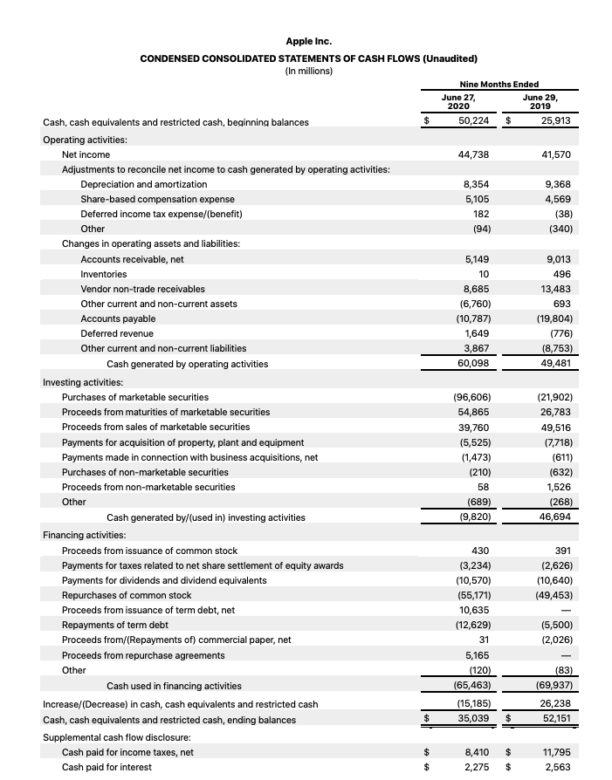
Find Apple’s cash flow statement for the third quarter of 2020 below. As is specified on the sheet, the numbers presented are in millions.
- Operating activities: Gain of $60,098
- Investing activities: Loss of $9,820
- Financing activities: Loss of $65,463
How are financial statements used?
Financial statements are used by a number of parties to analyze a company’s profitability, financial health, and stock projections. Some individuals or groups who use companies’ financial statements include:
- Government agencies and tax professionals: To audit income taxes and returns
- Creditors: To assess whether a company should be considered for a loan, based on their financial stability and ability to repay debt
- Current and potential investors: To weigh the financial success of an existing investment or a company’s investing potential
- Analysts: To analyze company performance and predict stock prices
- Current and potential employees: To understand a company’s stability and success to assist with career decisions
- Competitors: To understand the competitive landscape
- Other companies: To aid and justify strategic partnership decisions
Notable financial statement ratios
“Once you know how to select and calculate financial ratios, you can start looking at them over time to spot trends or warning signs. And you can also compare your company ratios to competitors or to industry averages to see how your company stacks up.” —Nic Barnhart, cofounder of Pareto Labs
At a glance, balance sheets, income statements, and cash flow statements seem to be a bunch of numbers labeled assets, liabilities, equity, revenue, and expenses. However, there are several financial ratios that you can apply to these reports to glean meaning from all that financial information.
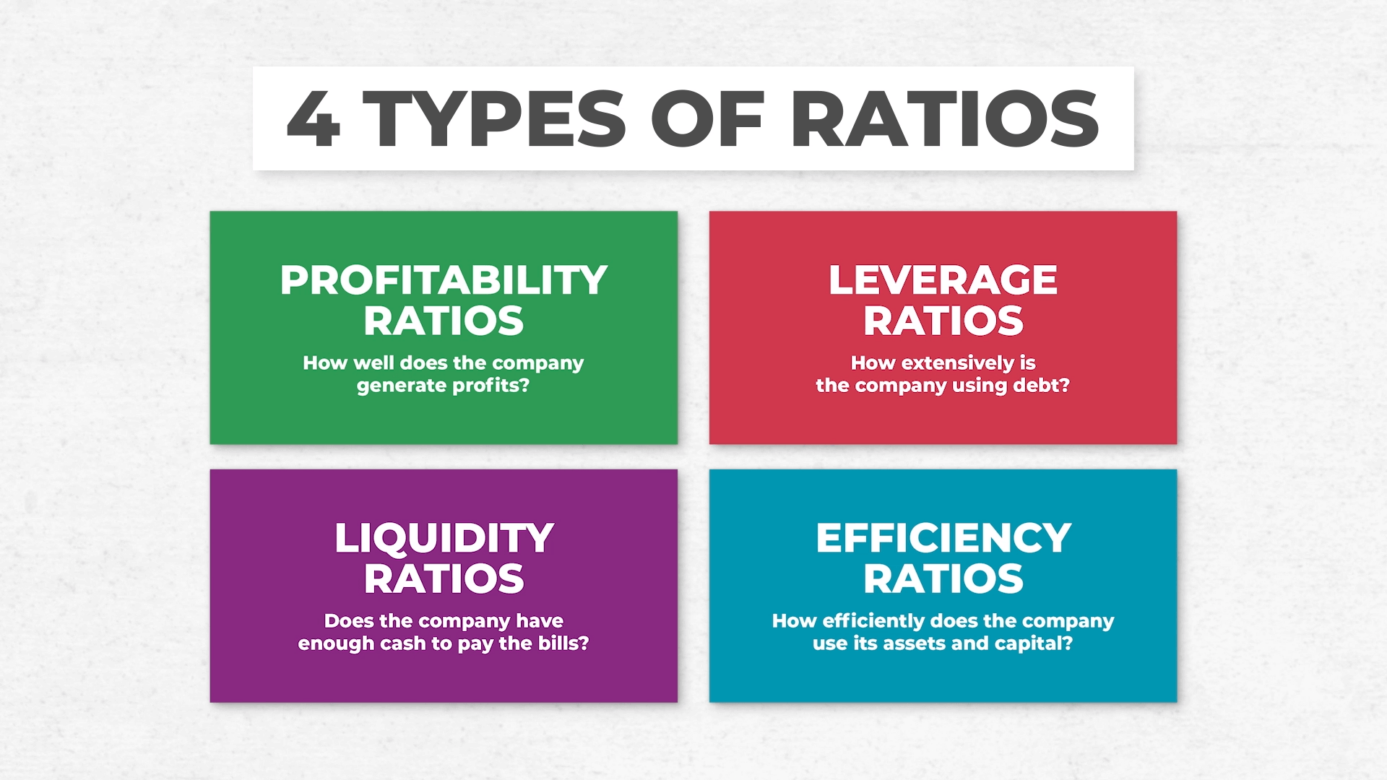
There are four different types of financial ratios.
- Profitability ratios: How well a company is producing profits
- Leverage ratios: To what extent a company uses debt
- Liquidity ratios: Indication of whether a company has enough cash to cover its expenses
- Efficiency ratios: How efficiently a company uses its assets and capital
Within these four types of financial ratios, there are specific formulas that companies commonly use.
- Operating profit margin percentage: The ratio of operating income to revenue
- Debt-to-equity ratio: Often referred to as D/E ratio, this measures a company’s liabilities against shareholders’ equity.
- Inventory turnover ratio: An illustration of how many times a company has sold, used, or replaced inventory over a given time period, calculated as cost of goods sold divided by average inventory.
Pareto Labs offers engaging on demand courses in business fundamentals. Built to help you elevate your game at work, our courses distill complex business topics — like how to read financial statements, how to manage people, or even how to value a business — into digestible lessons. No business background required. Our library of 200+ lessons will teach you exactly what you need to know to use it at work tomorrow. Sign up for a free trial today to start watching.
